Configure the ClickHouse Driver for Grafana
Hydrolix for AWS includes a preconfigured Grafana installation. If you want to use another instance of Grafana that’s not automatically configured to query your Hydrolix database, follow these steps to connect it.
Connect Grafana to Hydrolix
Administrator Access Required
You must have administrator access to your Grafana instance to connect to Hydrolix.
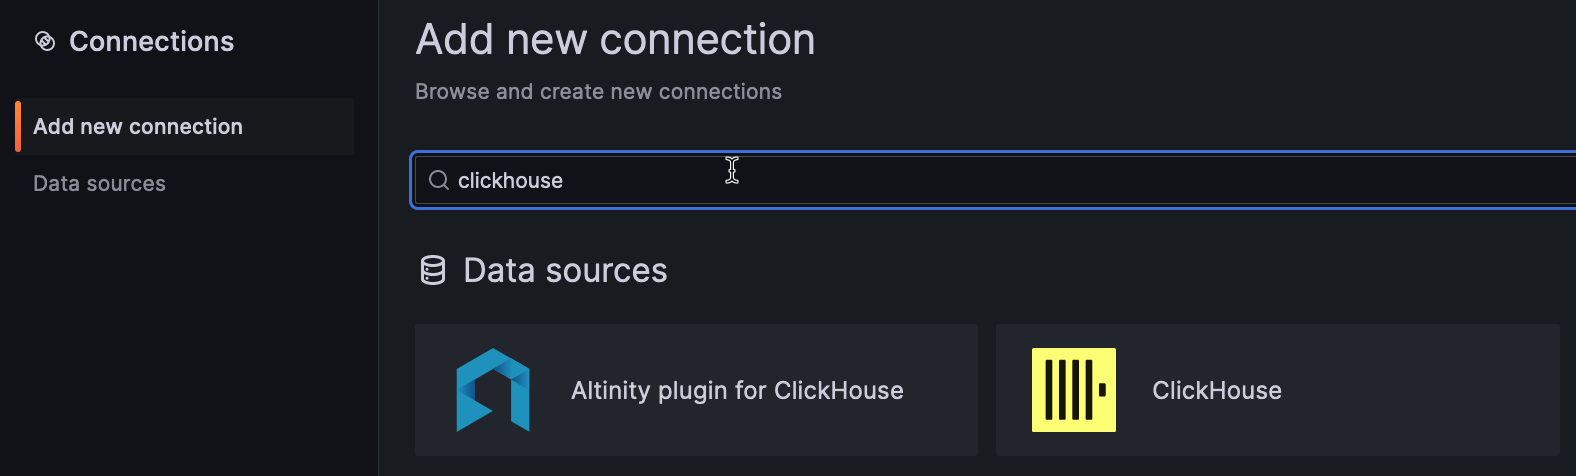
Follow the instructions in the Grafana documentation to add a new data source . Click on “Add new connection” and filter for “ClickHouse.”
You will see several options, but the one you want to use is the “ClickHouse” data source with the yellow logo:
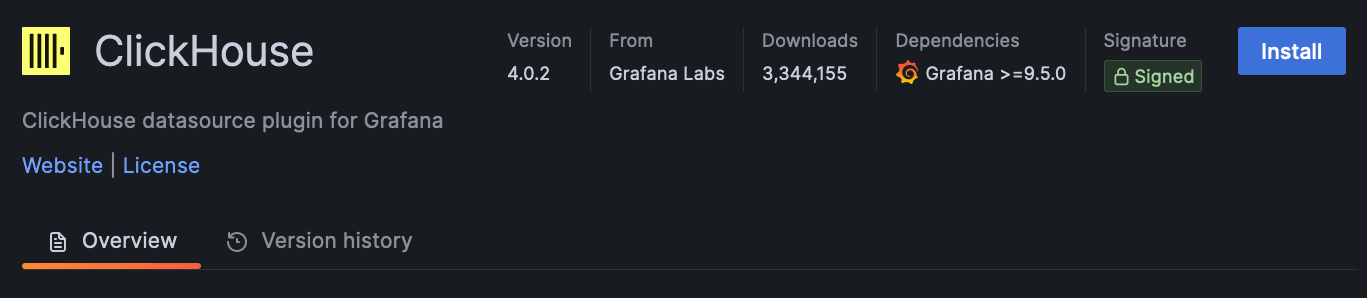
Select it, and click the “Install” button in the upper right-hand corner:
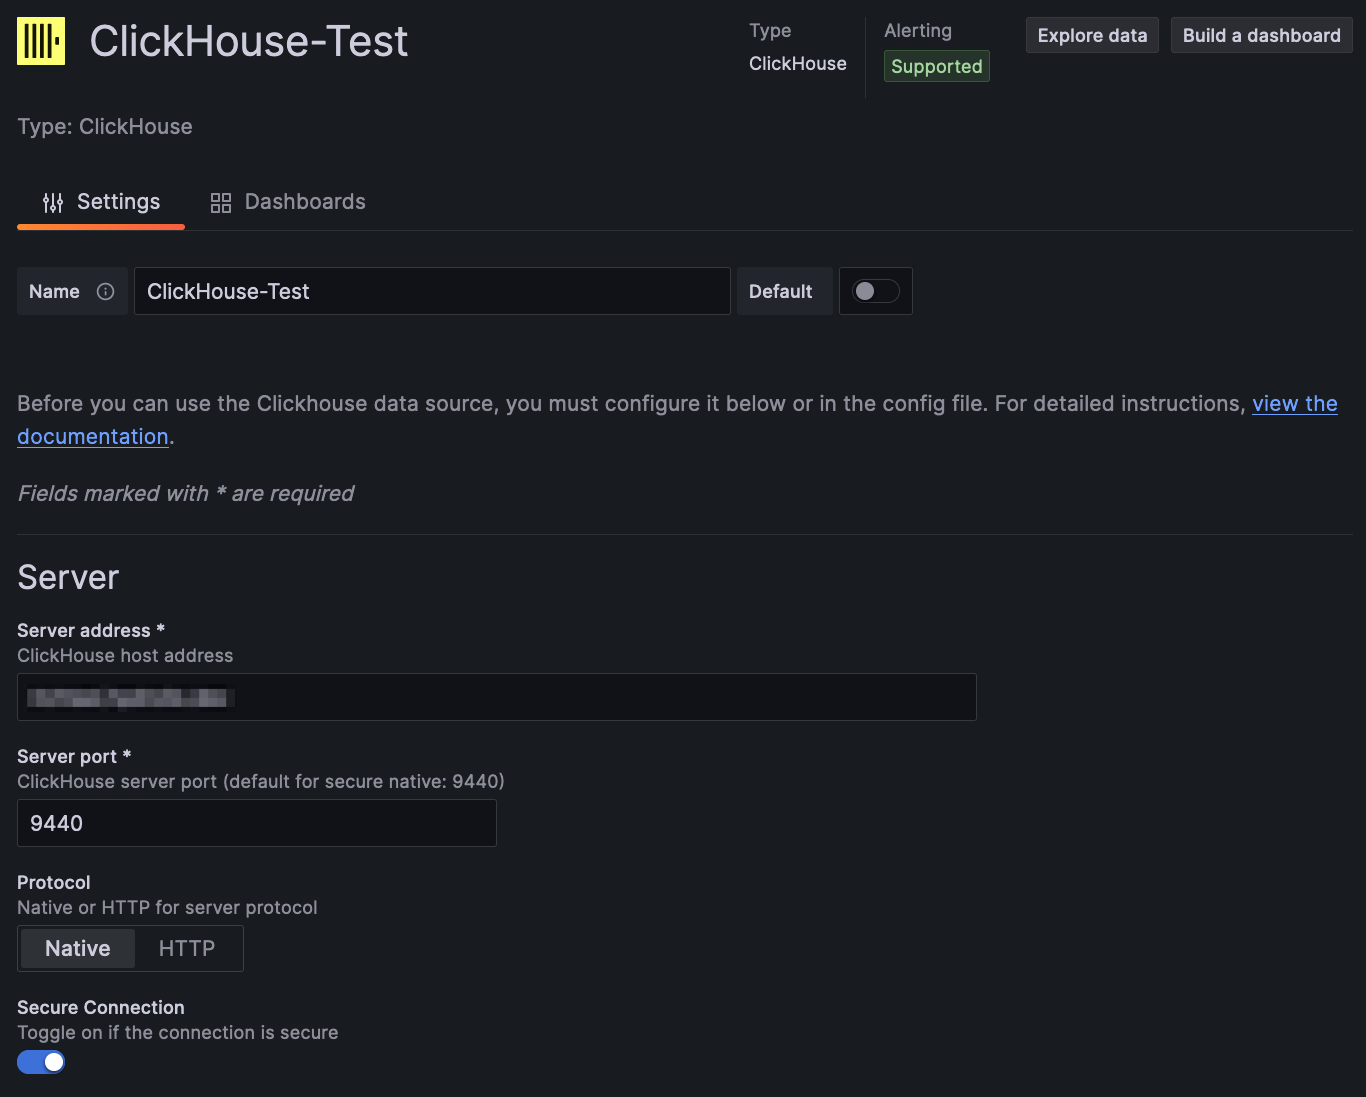
Configure a new data source by clicking the "Add new datasource" button.
While configuring, do these things:
-
Enter a unique name for this Hydrolix connection.
-
Enter your Hydrolix hostname for the server address. It will follow this format:
<host>.hydrolix.live. If you don't have this information, reach out to your Hydrolix service representative. If you are on a shared infrastructure, it will look like an airport code as the hostname, such asord.hydrolix.liveorams.hydrolix.live. -
Enter 9440 for your server port.
-
Select the Native protocol.
-
Enable Secure Connection.
-
Enter a default database that contains the data you would like to visualize.
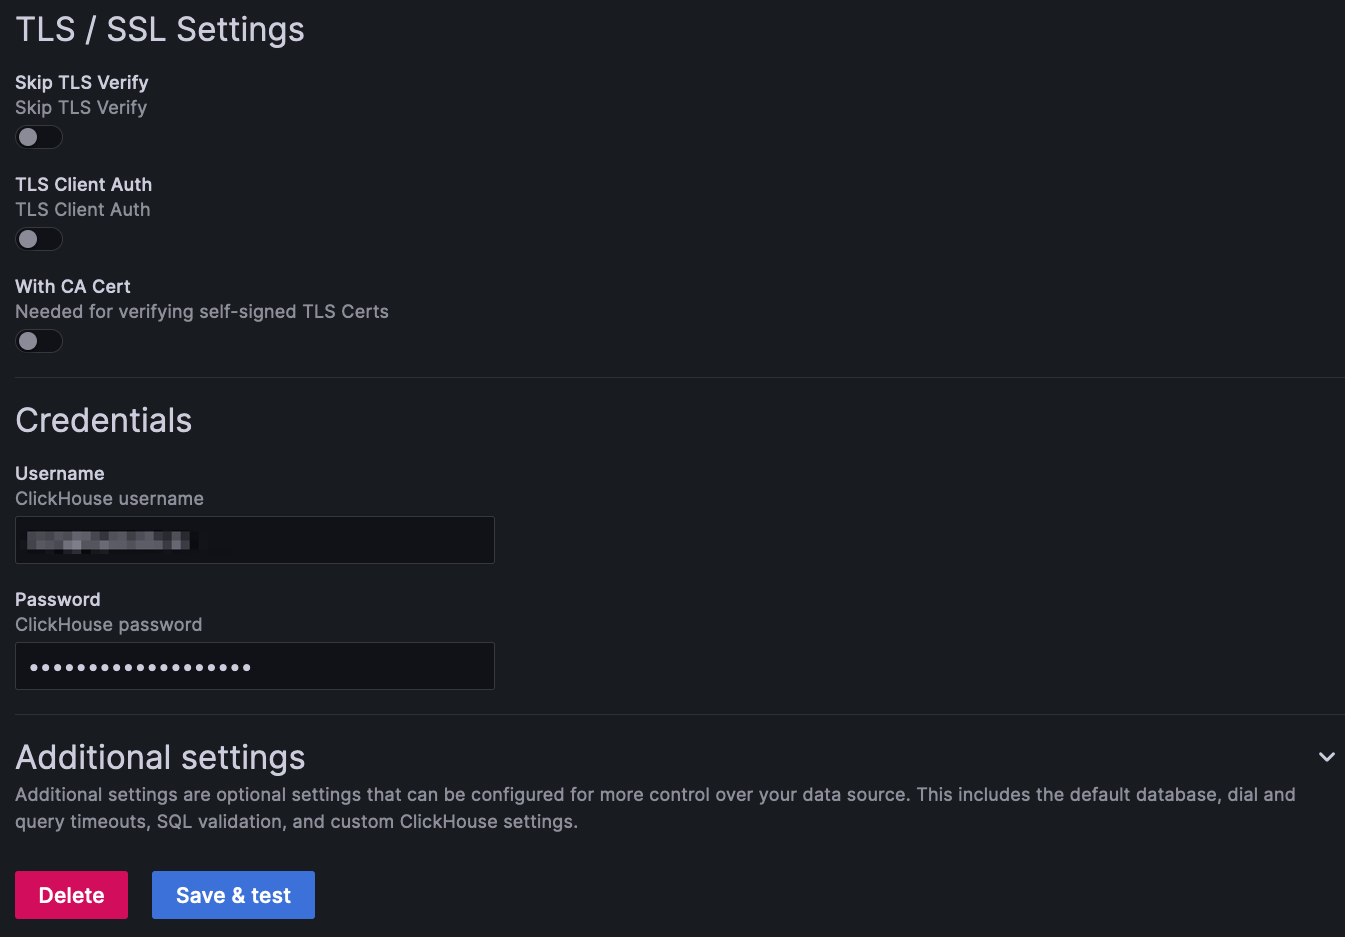
- Click "Save & test" to verify the connection.
If you’ve configured everything correctly, you should see a “Data source is working” notification:
HTTP API Authentication
Hydrolix for AWS also supports queries via an HTTP endpoint. Perform authentication using your username and password passed via an Authorization header. This basic authentication base64-encodes the username and password, separated by a colon.
The following snippet shows how to authenticate via username and password with the curl command:
curl --user user:password
  --request POST
  --url <https://hostname.company.net/query/>
  --data 'SELECT column FROM table'
Updated about 2 months ago