Grafana Manual Installation
Use Grafana to visualize data stored in your Hydrolix cluster.
Use this page to create a new instance of Grafana in EC2, install the Hydrolix data source plugin, then connect Grafana to a Hydrolix cluster using the plugin,
You can also use the built-in Grafana in your Hydrolix cluster. See Grafana Automatic Installation.
Create a Grafana instance
Already running Grafana?
If you already have an instance of Grafana running, be sure to install and configure the Hydrolix data source plugin to communicate with a Hydrolix cluster.
Prerequisites
-
A VPC with public access and access to Hydrolix, either through a load balancer or with a public IP address
-
Grafana administrator role access, added during instance creation
-
Install
apt-transport-httpssudo apt-get install apt-transport-https -
Install
software-properties-commonandwgetsudo apt-get install software-properties-common wget
Create an EC2 instance
-
In the VPC, launch an EC2 instance with the following attributes:
Parameter Setting OS Ubuntu Server 20.04 LTS (HVM), SSD Volume TypeInstance type t2.microSubnet Choose public and assign a public IP. Security group Default SSH access. Add access to the default Grafana port, 3000.Access Choose a key pair. Use the default option for all other settings.
-
Click Launch instance to create the EC2 instance.

-
Once the instance is in the
runningstate, connect to it with SSH.ssh <my-instance-url> -
Update the package list.
sudo apt-get update -
Upgrade the packages to the latest available version with the built-in package manager.
sudo apt-get upgrade -
Use
wgetto download the Grafana GPG key.wget -q -O - https://packages.grafana.com/gpg.key | sudo apt-key add - echo "deb https://packages.grafana.com/oss/deb stable main" | sudo tee -a /etc/apt/sources.list.d/grafana.list -
Update the package list again.
sudo apt-get update -
Install Grafana.
sudo apt-get install grafana
Install the Hydrolix data source plugin
Use the plugin catalog.
To install the plugin using automation, or to install a specific version, use the Grafana CLI.
See more methods of installation in install a plugin.
Use the plugin catalog
To install the Hydrolix data source plugin:
- Open the plugin catalog in your Grafana instance (
https://{grafana-url}/plugins). - Search for Hydrolix Data Source.
- Select the plugin and click Install Plugin.
For more details about installation, see Grafana’s Plugin management documentation.
Use the Grafana CLI
-
Install the Hydrolix data source plugin:
sudo grafana cli plugins install hydrolix-hydrolix-datasource✔ Downloaded and extracted hydrolix-hydrolix-datasource v0.6.0 zip successfully to /var/lib/grafana/plugins/hydrolix-hydrolix-datasource Restart Grafana after installing or removing plugins. Refer to Grafana documentation for instructions if necessary. -
sudo systemctl restart grafana-serverYou can verify that Grafana is running with the following command:
sudo systemctl status grafana-server
Connect Grafana to Hydrolix
Admin Access Required
You must have administrator access to your Grafana instance to connect to Hydrolix.
- In Grafana, go to Connections > Data Sources > + Add new data source.
- Select Hydrolix from the list.
Now configure the data source:
- Enter a unique name for this Hydrolix cluster connection.
- Enter your Hydrolix cluster hostname for the server address.
- Enter
9440for your server port. - Select the Native protocol.
- Enable the Secure Connection toggle if your Hydrolix cluster has TLS enabled.
- Credentials can be provided in the form of user account (user/pass) or service account (token). If you're using a service account, you can generate a token using the UI instructions or the API instructions.
- Click Save & test to verify the connection.
Add a Dashboard
-
Select
New>New dashboard. -
Select
+ Add visualization. -
Select
Hydrolix - Localfrom the data source dropdown. -
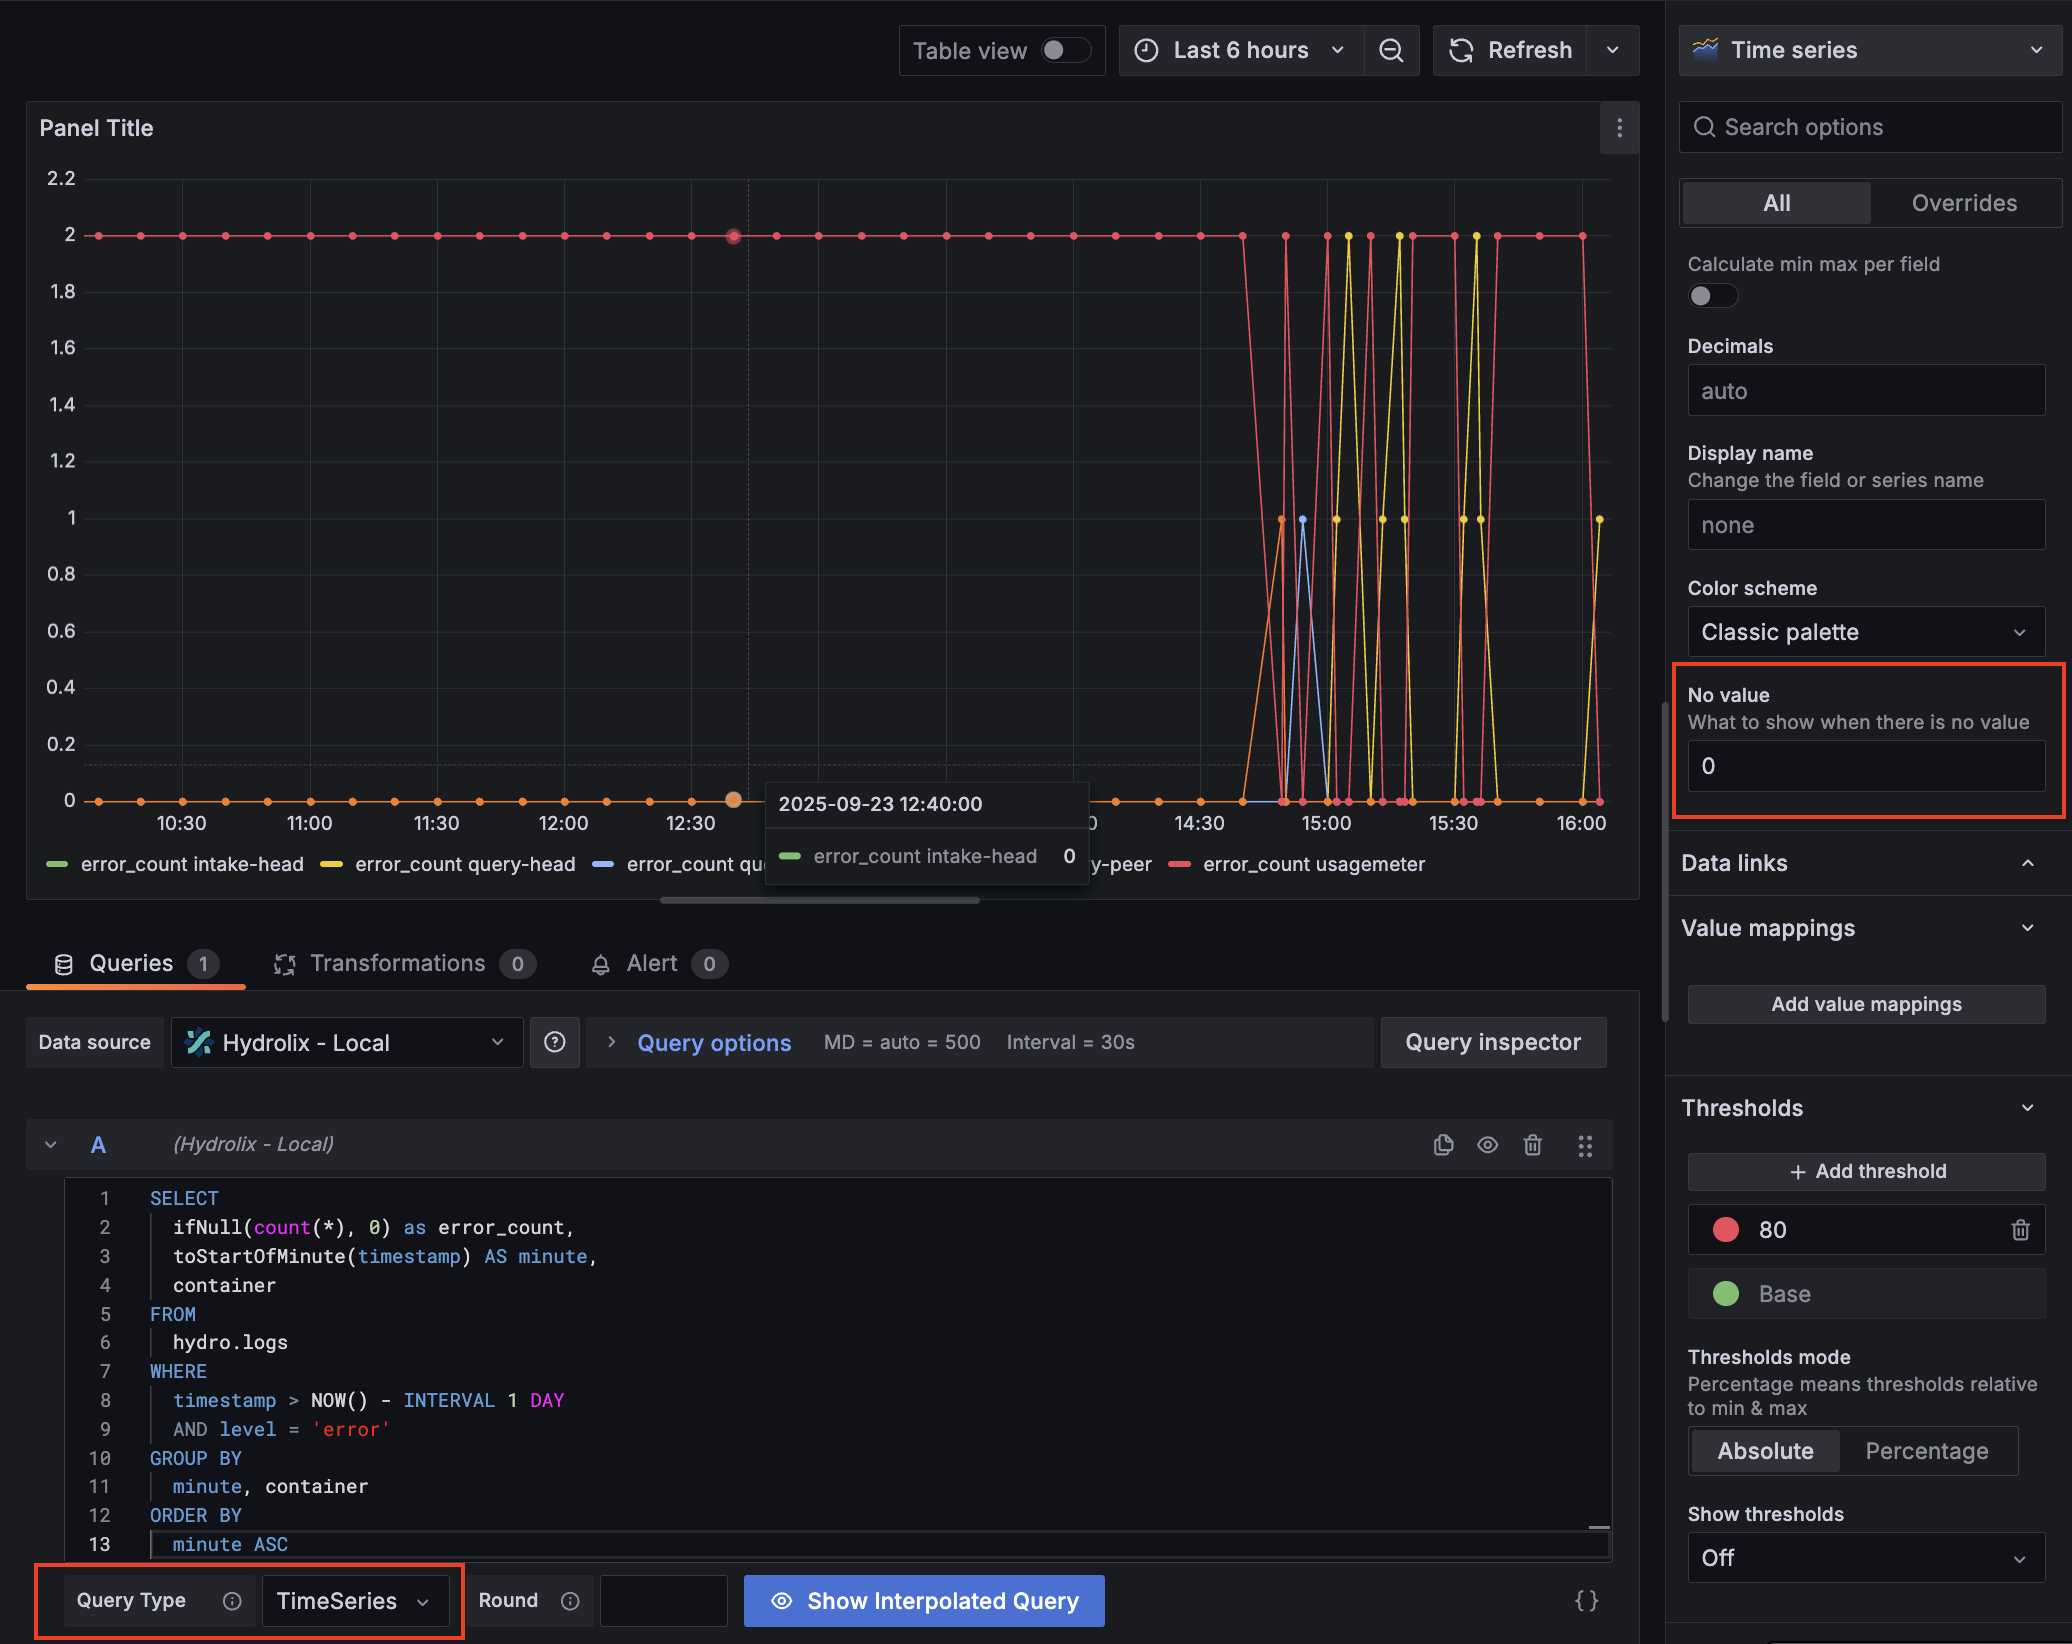
Paste the following query into the query input box:
SELECT count(*) as error_count, toStartOfMinute(timestamp) AS minute, container FROM hydro.logs WHERE timestamp > NOW() - INTERVAL 1 DAY AND level = 'error' GROUP BY minute, container ORDER BY minute ASC -
Change
Query TypetoTimeSeries -
In the right-hand panel, change
No valueto0.
You should now have a timeseries visualization showing the count of errors by container for your Hydrolix cluster.
- Select Save dashboard to save this visualization in a new dashboard.
Updated about 1 month ago