Step 1 - Model Storage
Before you start modeling your data, you'll first need to understand how data is structured in Hydrolix. After you learn the basic data structures, you'll build your metadata for this tutorial.
Hydrolix Data Structure Overview
Let's start by taking a look at how Hydrolix uses organizations, projects, and tables to organize data.
- Each Hydrolix environment has an organization.
- Each organization can have several projects that you can use to organize sets of data. For example, one project might be used to store firewall data while another stores web access logs.
- Each project stores tables. Each table corresponds to a logical group of attributes that are stored, indexed, and managed together.
The next image shows an example of how tables might be stored in projects.
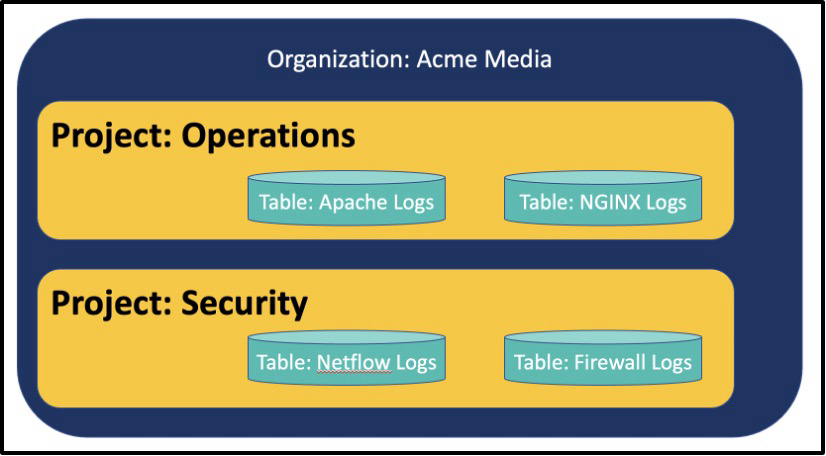
Figure 1 - Logical Data Hierarchy in Hydrolix
Tables are modeled with transforms, which specify how your data should be stored in the table. Transforms are defined before you write any data to your tables. This may sound rigid, but you can add new fields to a table later as needed. Transforms can be modified after data is ingested, though it's recommended that you add new fields instead of modifying existing fields. Additionally, tables can have multiple transforms, each with their own sets of fields for the table, as shown in the next image. For most log scenarios, you'll only need one transform.
Transforms define the actual fields stored in each row of a table. Fields as defined in the transforms are typically a string, integer, double, or a timestamp, but other data types are supported as well. Each row will require a timestamp.
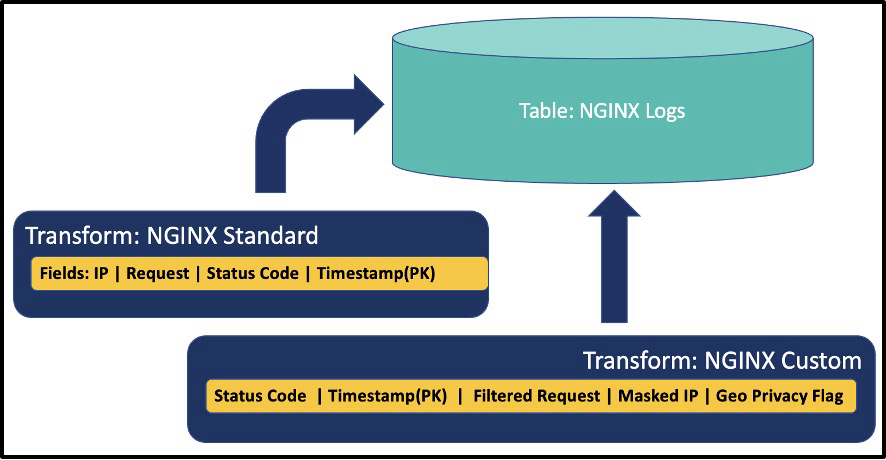
Figure 2 - Transforms Define Fields in Tables and Share Primary Key (PK)
Now that you understand the basics of how data is organized in Hydrolix, you're ready to start modeling your data. Make sure you have installed all the tools in the prerequisites first.
Transforming Data with HDXCLI
If you haven't done so already, download and set up the hdxcli command line tool. Set the HDXCLI profile so you can connect to your Hydrolix, and then download and cd into the NGINX example root directory.
The following commands will set up a project, create a table, and load data. Your cluster will already have an organization. To build out the project, table, and transform, update the variable in brackets {} and run:
# be sure to update {PROFILE_NAME} with your profile name for hdx_cli
# be sure to run this from the github directory you downloaded.
# be aware you might get prompted for your password on hydrolix
# note: two dashes below not one
hdxcli --profile {PROFILE_NAME}  project create hydrolix_demo_projects
hdxcli --profile {PROFILE_NAME}  --project hydrolix_demo_projects table create nginx
hdxcli --profile {PROFILE_NAME}  --project hydrolix_demo_projects --table nginx
transform create -f nginx_access_logs.json nginx_access_logs
There you go! all done! Easy right? You’ve now built a project into your organization, added a table to that project, and associated a transform defining acceptable fields in the table. In the next section, we’ll overview the components of a data transform and provide some guidance on how to work with them. In the meantime, log into the Hydrolix cluster UI and see your work by clicking on the Data section on the left nav (see Figure 3).
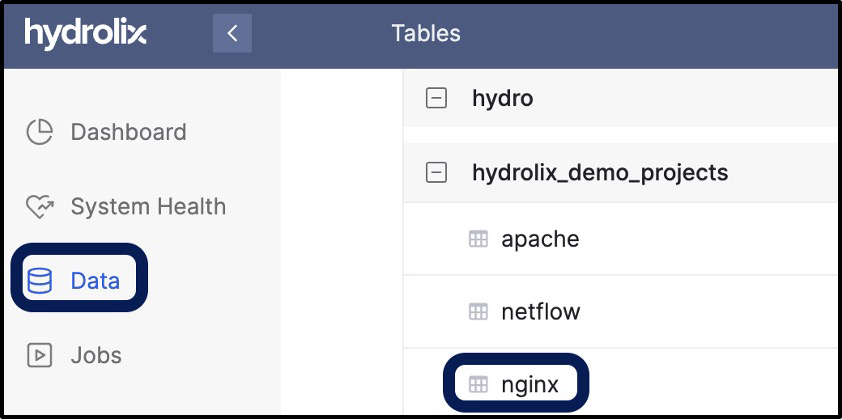
Figure 3 - Data Show Tables
If you click on nginx, the new table you built, you can go look at the default table settings and also access the transform (see Figure 4). Many settings in Hydrolix are set at a table level; notice in the starter project you downloaded from github, there is a build script and a function with sample commands to set the table - those examples will come in handy later on. That script will also get you started later if you need a script to automate the build.
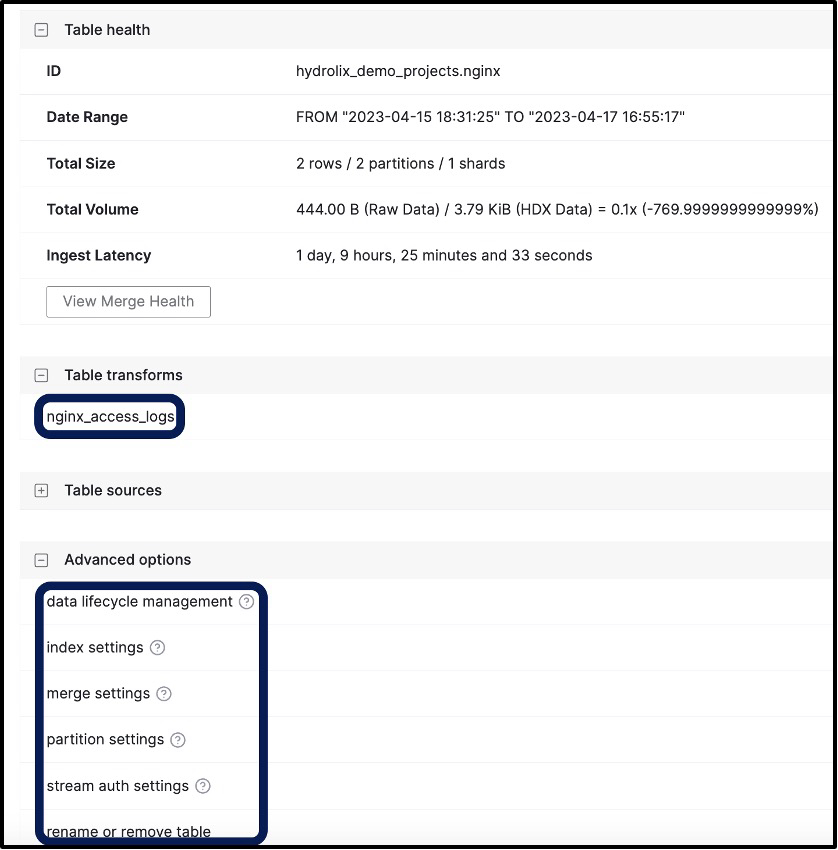
Figure 4 - Table Details Including Associated Transforms and Settings
The items we built could have been easily done through the UI screens by clicking new (see Figure 5) in the upper right corner and building a table, then building out a transform the same way. In our case, we opted to use HDXCLI to build a table and then use the nginx_access_logs.json file to build out the transform for us.
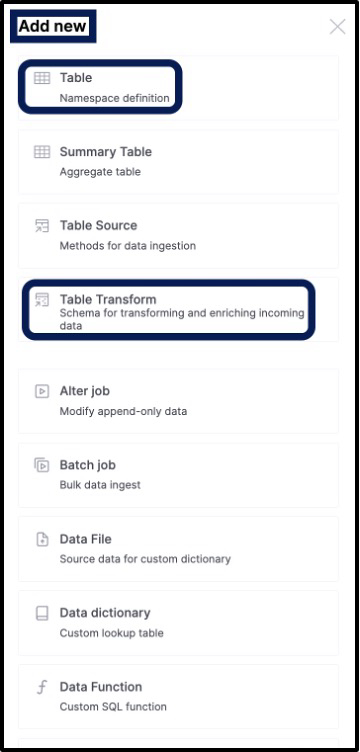
Figure 5 - Adding New Tables and Transforms
Projects, tables, and transforms can be built in Hydrolix by using:
- HDXCLI
- UI screens
- RESTful API
Each method has its own advantage. Given we just built a data transform and didn’t discuss it much, let’s do that next. If itching to move on and just do things, do ahead and skip over to ingest.
A Closer Look at the Data Transform
Let’s get back to our table and look at the nginx_access_logs which we built. You can do that by clicking on the three vertical dots to the right of the transform from the nginx table page and then clicking edit (see Figure 6).
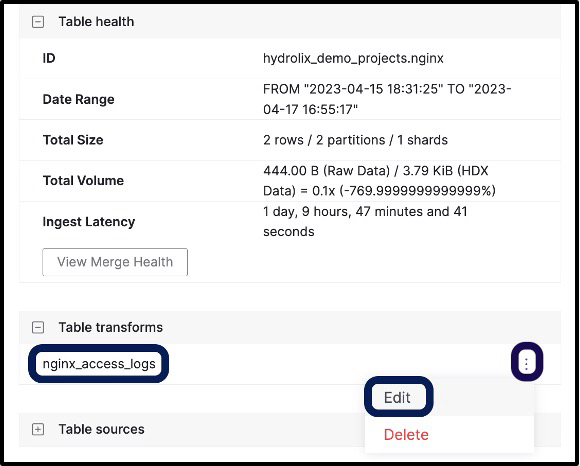
*Figure 6 - Navigating to Edit the Transform of a Table
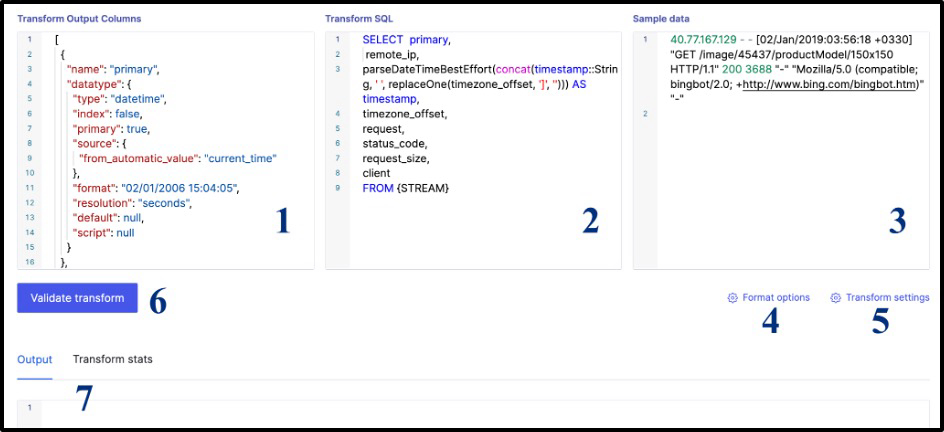
Figure 7 - Editing Transform
Transforms are the main way to model data as it will be ingested into Hydrolix. The resulting edit transform screen (see Figure 7) shows the components which make up a transform:
- Transform Output Columns (1 in figure) - are the defined fields for your table. Some fields are incoming from the ingested data, others are derived from the ingested data, and others are automatically calculated - such as the primary timestamp which marked when the data is stored. Each table has a primary key which is specified in the table. Event-based fields, such as logs, tend to be timestamps, strings, doubles, and integers. Fields can be indexed so that they can be used for filters in SQL statements, and full text search can be enabled per field.
- Transform SQL (2) - enables users to transform (the T in ETL) incoming data using SQL. In the NGINX example, SQL is applied to incorporate the time zone. Clickhouse has a very rich set of functions which are commonly used to:
- Drop rows
- Set fields to null which are redundant and expensive to store (e.g. high cardinality, random patterns that do not compress well).
- Manipulate Strings and numbers
- Convert timestamps to acceptable format
- Decode and encode fields (URL and base64 encoding are quite common)
- Sample Data (3) - ships with the transform and enables you to modify your transform and click the Validate button (6) to see results in the output console (7).
- Format options (4) - is used to designate format of delimiters and number of header lines in incoming data (if CSV and not JSON)
- Transform settings (5) - sets default transforms and assigns null equivalent values in fields
Some people like to use this UI screen to modify transforms and test results. Alternatively, you can use the JSON of the transform (like nginx_access_logs.json provided in the sample project) to manipulate within an IDE like VS Code and then upload the transform using hdxcli. The latter method is a little bit more complex, but opens up the ideal case of keeping transforms in source control for a team.
Notably, if making a change to a column name, the transform SQL will need to be able to reference the same name, so add an additional field with the new name to continue to have access to data stored under the original field name. Also, fields within a JSON type document (not illustrated with NGINX example) can be referenced by the path to the field within the JSON document structure.
As it turns out, you can even use sample data to get an initial suggested data structure of the transform using the Hydrolix UI (see Figure 8). While creating the new transform, you just click “Generate” and provide the delimiter and sample data. Simple! The best guess isn’t perfect, and most of the work will be done for you.
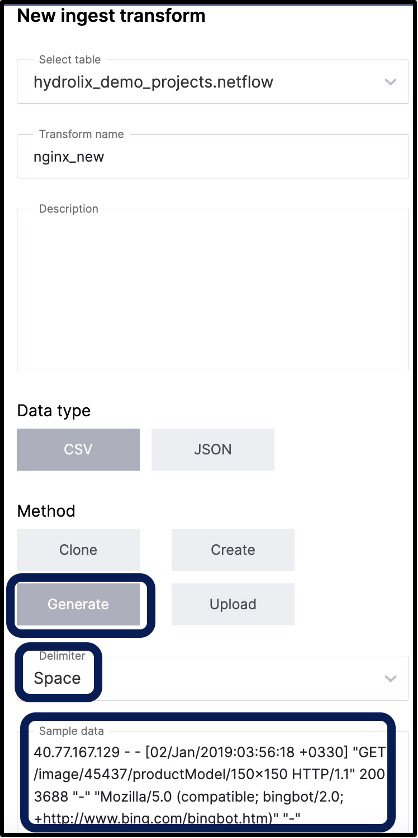
Figure 8 - Creating a new transform with sample data
Before we leave this section, we’d like to point out that Hydrolix provides a sample transforms repo on github with lots of examples to be able to learn from and use. If you’d like to contribute, please do send us a pull request!
Updated 5 months ago